The effect of obstacles on wind measurements needs to be filtered out.
For wind measurements the World Meteorological Organization (WMO) requires that the measurement is at 10 m height, the measurement site flat, the surface roughness comparable to that of cut grass, and the measurements unobstructed by e.g. trees or buildings. Even when the WMO requirement with regard to obstacles is met (namely that the distance to the obstacle should be at least 10 times the obstacle’s height), wind measurements are often disturbed, either by obstacles further away or because the surface roughness is not that of cut grass in some or all wind directions. Of course these effects are real, but they need to be filtered out to make the measurements useful for climate change research (“is wind speed really decreasing or are there just more obstacles?[1]”) and for the validation of weather models (with roughness lengths averaged over grid boxes). Wieringa[2] found a way to do this (and also correct for differences in measuring height) and introduced the potential wind based on measured Exposure Correction Factors (ECFs).
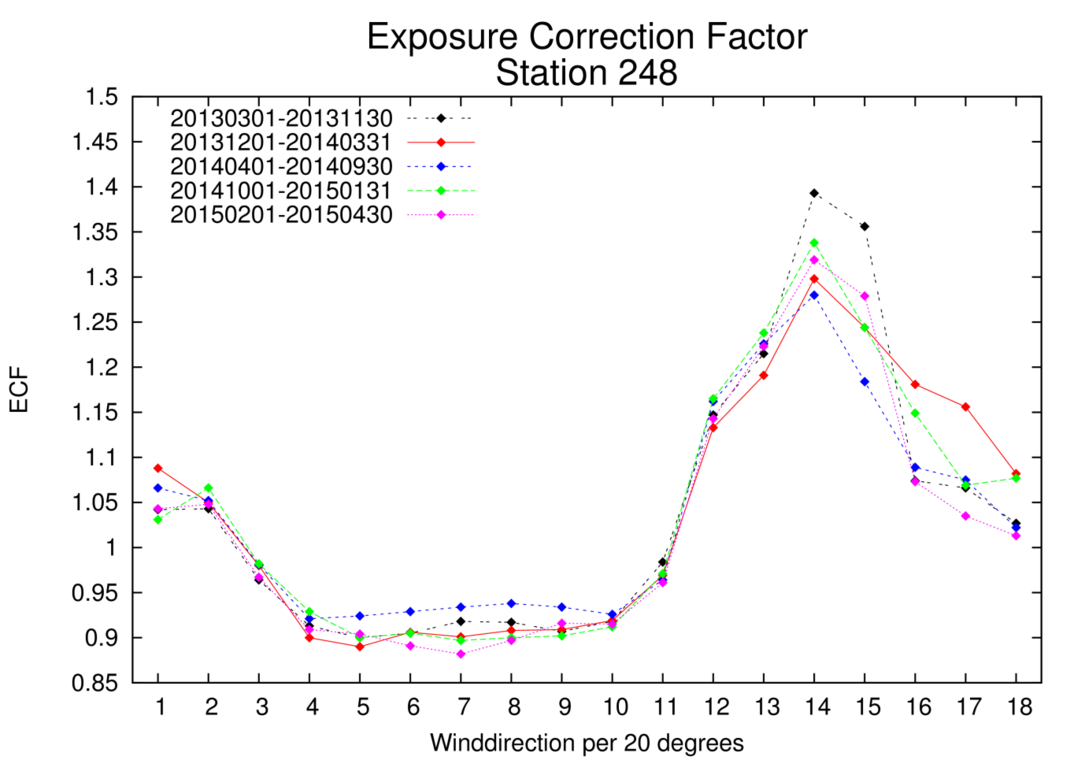
The ECF is a measure of the roughness of the surface up to about 2 km from the site of interest and, therefore, varies with wind direction and - for some sites - season. That is why ECFs are determined for wind direction sectors of 20° (e.g. 25-44°) and - for some sites - winter (from November to March) and summer (from April to October). There are two ways of determining ECFs from measurements: (1) gustiness analysis, where the maximum gust (3 second average) divided by the hourly average wind speed is a measure for the roughness of the terrain (Verkaik[3]) and (2) sigma analysis, using 10 minute averages and the standard deviation of the fluctuations in the wind speed during those 10 minute periods (Wever/Groen[4]). The second method is better, but requires 10 minute measurements that were not available for all KNMI stations until 2003. Fortunately, there is a way to derive sigma analysis ECFs from gustiness analysis ECFs.
The potential wind speed is the measured wind speed multiplied by the ECF. The ECF corrects for the effect that a different roughness (than the one of cut grass) and measuring height (than 10m) have on the wind speed. The potential wind speed therefore meets the WMO requirement. No correction is applied to the wind direction.
The KNMI series of potential wind are updated every month, sigma-analysis potential winds (https://www.knmi.nl/nederland-nu/klimatologie/sigma-analyse-potentiele-wind) and new ECFs are calculated every 3 years.
[1] Wever N (2012), Quantifying trends in surface roughness and the effect on surface wind speed observations, Journal of Geophysical Research, 117, D11104, doi:10.1029/2011JD017118.
[2] Wieringa J (1976) An objective exposure correction method for average wind speeds measured at a sheltered location. Quarterly Journal of the Royal Meteorological Society 102: 241-253.
[3] Verkaik J (2000) Evaluation of Two Gustiness Models for Exposure Correction Calculations. Journal of Applied Meteorology 39(9): 1613-1626.
[4] Wever N, Groen G (2009) Improving potential wind for extreme wind statistics. Scientific report: WR2009-02. Royal Netherlands Meteorological Institute (KNMI)