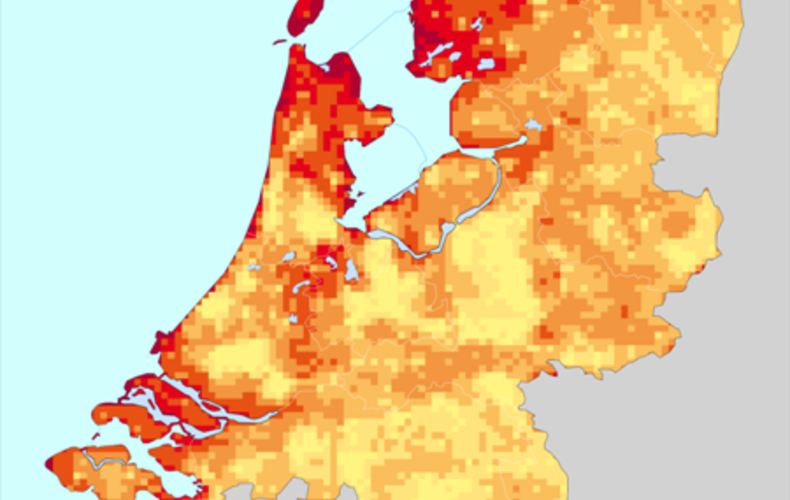
There are different ways of creating gridded maps from observations. The aim of this study was to find an adequate method of producing interpolated maps of the yearly and monthly normals of the surface wind speed at all grid points in The Netherlands.
For 31 stations in the Netherlands, we had potential wind speed time series with 30 years of data (with at least 20 yearly or monthly averages) available as input for our method. Using Wier-inga’s 2 layer model (2LM) of the planetary boundary layer (later refined by Verkaik) the wind speed at the top of the boundary layer was calculated for each location. At this height above the relatively flat Dutch landscape, the (“macro”) wind flows freely, undisturbed by variations in the underlying surface roughness. This makes it an ideal height for interpolating the wind speed. Af-ter interpolation, surface wind speeds were calculated for all the grid values of the macro wind using the 2LM and a map of the surface roughness of The Netherlands. The 2LM and WAsP (the wind energy industry standard for wind resource assessment) use identical physics but WAsP as-sumes a constant macro wind where we interpolate normals of the macro wind. Because we had to work with normals, all information on wind direction was lost. This information is required in WAsP for correction of the wind speed due to nearby obstacles or speed-up of the wind caused by hill slopes, whereas the 2LM takes neither into account.
Many aspects of the method were varied to improve the output map. For example, which sta-tions to use and which not, the interpolation method, the size of the spatial footprint used to de-termine the values of the terrain roughness and whether or not to include roughness due to local differences in orographic height. In order to choose the most adequate version of the method, we looked at two aspects: how well the output compared to model and measured winds and how well the pattern of wind speeds met the expectations of wind experts. Our most adequate method makes use of input data from all but one station: the quality of the measurements at Rotterdam Geulhaven are too poor due to it’s unique location in a built-up international port area. We used the inverse distance weighting interpolation method with an IDP of 2. The local surface rough-ness was represented by 2.5 km pixels and the meso- or regional roughness by 10 km pixels. Ad-ditional regional roughness due to orography was not used.
A Stepek, IL Wijnant, G Groen, P Hiemstra, R Sluiter. Interpolating wind speed from the sparse Dutch network to a higher resolution grid using local roughness from land use maps
Conference: 13th International Conference on Wind Engineering, Place: Amsterdam, Year: 2011, First page: 0, Last page: 0